
measuRing: R package to measure tree-ring widths from scanned images
measuRing' es una librería programada en ambiente R para detectar y medir anillos de crecimiento en imágenes escaneadas de nucleos dendrocronológicos. Esta librería integra la medición de anillos de crecimiento con el poder estadístico del R. Los algoritmos en 'measuRing' calculan reflectancias a partir de secciones de imágenes produciendo matríces de grís (MG) y sus correspondientes series promedias suavizadas (SPS). Tanto las MG como las SPS son graficadas en segmentos de imágen facilitando el proceso de control visual en el proceso de identificación de anillos. La librería provee funciones para incluír o excluír anillos de crecimiento de manera visual con la ayuda de la interfaz gráfica del R, o para detectar automaticamente los anillos mediante implementación de un algoritmo de detección lineal. El paquete 'measuRing' se puede instalar gratuitamente desde el ambiente R mediante el comando install.packages('measuRing'). Más información sobre measuRing está disponible en la página de librerias de R y en ese artículo
measuRing example
This is an example to measure tree-ring widths in scanned images with the R-package ‘measuRing’. If users run R from Interactive Development Environments (IDE), they should be sure that such environments support multiple graphics devices.
The first requirement is to install and require the package from the R environment:
#uncomment following line to install the package:
#install.packages('measuRing')
require('measuRing')
## Loading required package: measuRing ## Loading required package: pastecs ## Loading required package: boot ## Loading required package: png ## Loading required package: tiff
Then, it is necessary to provide a path to the scanned image. In this example we will use a tif image provided with the package:
image1 <- system.file("P105_a.tif", package = "measuRing")
image1
## [1] "/home/wilar/R/x86_64-pc-linux-gnu-library/3.0/measuRing/P105_a.tif"
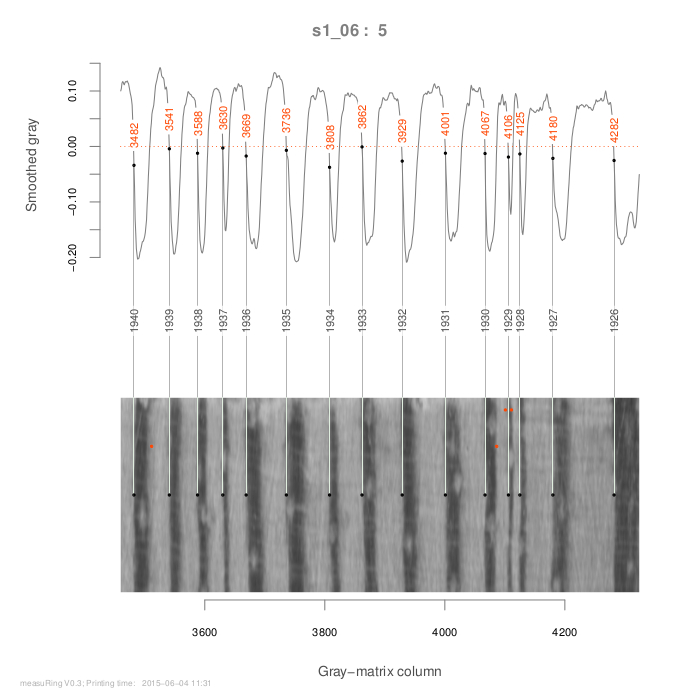
‘mearuRing’ has diverse functions, but the complete measurement procedure can be developed with only two functions: ‘ringDetect’ and ‘ringSelect’. Former function, ‘ringDetect’, processes the image section and records outputs from the measurement process. Function ‘ringSelect’ is used to manually select column numbers (positions of ring borders in the gray matrix of the image).
In this example, we will plot an initial diagnostic with three image segments (segs = 3); then, the function ‘ringDetect’ will be updated to include new arguments: some noise in smoothed gray will be avoided by moving argument origin from 0 to -0.03, formation year of the last visible ring will be fixed in 2012, and several column numbers will be included/avoided from the analysis (see vectors Toinc/Toexc). For instance:
detect1 <- ringDetect(image1, segs = 3)
detect2 <- update(detect1, origin = -0.03, last.yr = 2012)

Toinc <- c(202,387,1564)
detect2 <- update(detect2, inclu = Toinc)

Toexc <- c(208,1444,1484)
detect2 <- update(detect2, exclu = Toexc)
A good way to select the column numbers to be included/excluded is by using the function ‘ringSelect’:
## (uncomment and run):
## detect2 <- update(detect1)
## Toinc <- ringSelect(detect2)
## detect2 <- update(detect2, inclu = Toinc)

## (not run) Object detec2 is updated with Toinc;
##
## (not run)  ring borders to be excluded:
## (uncomment and run):
## detect2 <- update(detect2)
## Toexc <- ringSelect(detect2,any.col = FALSE)
## detect2 <- update(detect2,exclu=Toexc)
The distances between detected rings are stored in lists ‘detect1’ and ‘detect2’:
str(detect2)
## List of 3
##  $ ringBorders:'data.frame': 1610 obs. of  2 variables:
##   ..$ P105_a : num [1:1610] 0.0832 0.0962 0.1098 0.1211 0.1304 ...
##   ..$ borders: logi [1:1610] NA NA NA NA NA NA ...
##  $ ringWidths :'data.frame': 65 obs. of  2 variables:
##   ..$ year  : num [1:65] 2012 2011 2010 2009 2008 ...
##   ..$ P105_a: num [1:65] 1.016 0.813 0.686 0.94 0.813 ...
##  $ call       : language ringDetect(image1, segs = 3, origin = -0.03, last.yr = 2012, inclu = Toinc,      exclu = Toexc)
##  - attr(*, "gray.dim")= int [1:2] 20 1610
##  - attr(*, "opar")=List of 4
##   ..$ mfrow: num [1:2] 2 1
##   ..$ mar  : num [1:4] 3 2 3 2
##   ..$ oma  : num [1:4] 2 3 0 0
##   ..$ xpd  : logi NA
rings <- detect2$'ringWidths'
head(rings)
##     year P105_a
## 10  2012 1.0160
## 50  2011 0.8128
## 82  2010 0.6858
## 109 2009 0.9398
## 146 2008 0.8128
## 178 2007 0.4826
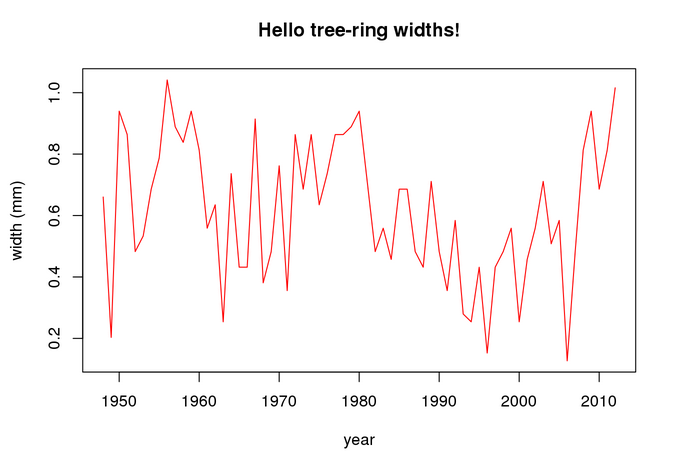
The detected ring widhts can be plotted as follows:
maint <- 'Hello tree-ring widths!'
plot(rings,ylab = 'width (mm)',type='l',col = 'red',main=maint)
measuRing en los medios de comunicación
DÓNDE ESTAMOS
ETS Ingenierías Agrarias Universidad de Valladolid - Avd. Madrid s/n
34004 - PALENCIA - Localización
www5.uva.es/etsiiaa/
INIA-CIFOR - Ctra. A Coruña km 7,5
28040 - MADRID - Localización
www.inia.es
COLABORACIÓN
Etiquetas
BOLETÍN IUGFS
Si deseas estar informado, apúntate a nuestro boletín electrónico.
Síguenos

 Acceso | Intranet | Política de privacidad Contenido Creative Commons. Sitio web desarrollado por Cesefor